Plot Sensor Data
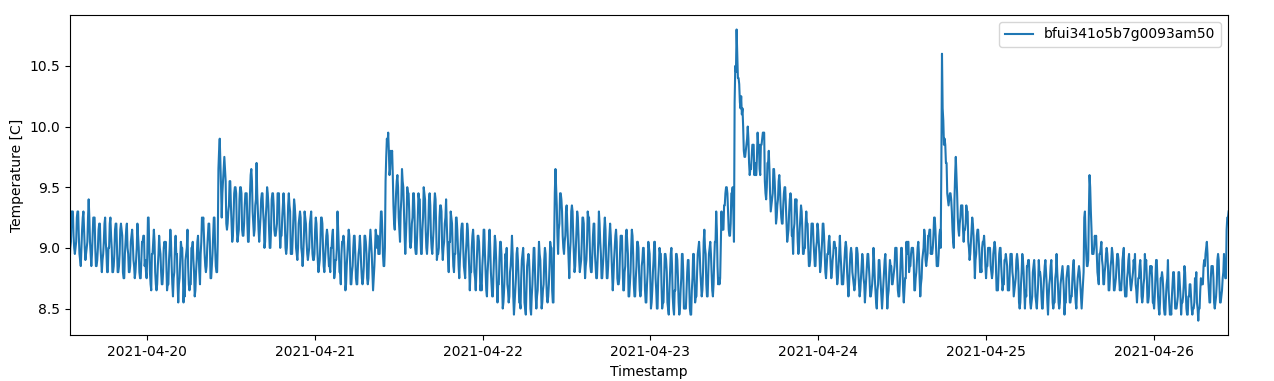
In this example, 7 days of historic temperature events are fetched and plotted for a sensor.
Full Example
The following snippet implements the example. Remember to update user-defined variables.
from datetime import datetime, timedelta
import matplotlib.pyplot as plt
import disruptive as dt

# User-defined variables.
DEVICE_ID = '<YOUR_DEVICE_ID>'
PROJECT_ID = '<YOUR_PROJECT_ID>'

# Fetch temperature events for the last 7 days.
event_history = dt.EventHistory.list_events(
    device_id=DEVICE_ID,
    project_id=PROJECT_ID,
    event_types=[dt.events.TEMPERATURE],
    start_time=datetime.today()-timedelta(days=7),
)

# Isolate timeaxis and temperature data which can be plotted directly.
timestamps = [event.data.timestamp for event in event_history]
temperature = [event.data.celsius for event in event_history]

# Generate a plot using the fetched timeaxis and temperature values.
plt.plot(timestamps, temperature, '.-')
plt.xlabel('Timestamp')
plt.ylabel('Temperature [C]')
plt.show()
Step-by-Step Explanation
The package is authenticated as described in the Authentication using environment variables.
Once authenticated, the temperature event history can be fetched using the disruptive.EventHistory.list_events() resource method. Default timerange is the last 24 hours, but here we provide a start_time 7 days ago.
history = dt.EventHistory.list_events(
    device_id=DEVICE_ID,
    project_id=PROJECT_ID,
    event_types=[dt.events.TEMPERATURE],
    start_time=datetime.today()-timedelta(days=7),
)
The returned event_history variable is list containing the fetched Events. Various data can be extracted quickly using simple list comprehension.
timestamps = [event.data.timestamp for event in event_history]
temperature = [event.data.celsius for event in event_history]
Finally, provided the matplotlib package is installed, the data can be plotted.
plt.plot(timestamps, temperature, '.-')
plt.xlabel('Timestamp')
plt.ylabel('Temperature [C]')
plt.show()